The use of Real-Time Operating System (RTOS) is increasingly common in embedded software designs, as an RTOS makes it easy to divide your code into smaller blocks, tasks, which execute seemingly in parallel and independent of each other. An RTOS provides multi-tasking, in a reliable and maintainable manner, which makes it easier to design applications with multiple concurrent functions such as control, communication and HMI. The overhead of an RTOS is negligible on modern 32-bit processors and is often more than compensated for by more efficient designs enabled by multi-tasking.
An RTOS typically implements preemptive multi-tasking using a periodic interrupt routine (the “tick” interrupt) that switches the running task when required. The decision of what task to execute is known as task scheduling and most RTOS use fixed-priority scheduling (FPS), where the developers assign each task a static priority level to indicate their relative urgency. The RTOS scheduler always chooses the task with highest priority from the tasks currently ready to execute. This is a quite simple and elegant solution that allows the RTOS scheduler to be very small, highly optimized and thoroughly validated.
It is however important to assign suitable task priorities, otherwise the system performance will suffer or the system might even become unresponsive. This is because high priority tasks may prevent lower priority tasks from executing if they consume too much processor time. Analyzing task priorities and runtime behavior of RTOS-based applications requires recording and visualization of the task scheduling. For this purpose Percepio offers the Tracealyzer tools with over 25 interactive views that make the recorded traces easier to comprehend and analyze.

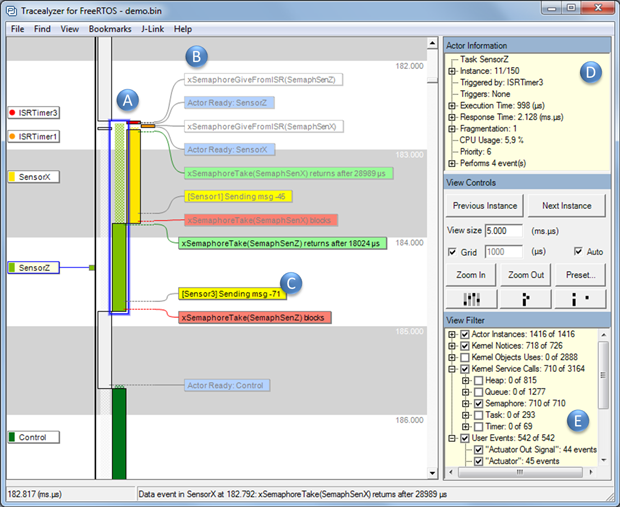
Figure 1 shows the main view of Tracealyzer, a vertical timeline focused on the execution of tasks and interrupt handlers (A) annotated with text labels showing events (B) including RTOS API calls and custom “user events” (C). The “Actor Information” panel (D) shows properties of the highlighted task and the “View Filter” (E) allows for filtering of the display. Double-clicking on task fragments or event labels opens other related views showing related points in the trace, e.g., a chronological list of all executions of a selected task.
The response time of a task, i.e., the time from activation until completion, is affected not just by the actual processor time used by the task itself (execution time), but also by higher priority tasks and interrupts that preempt the task, as illustrated in Figure 1. So if the response time is too long, optimizing the code of the problematic task might be a waste of time, unless you know what actually causes the long response time.

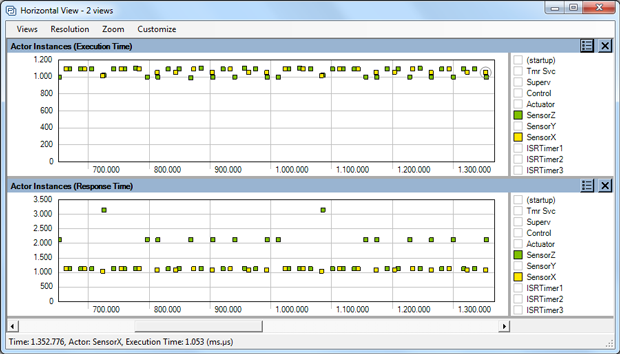
With Tracealyzer you get many perspectives of the runtime world, including plots of task execution times and response times like in Figure 2. We can see that execution times are pretty steady for both tasks, but sometimes the response time of “SensorZ” is much higher. By clicking on such a data point, you open the corresponding interval in the main trace view (Figure 1) and see the cause. All 25+ views in Tracealyzer are interconnected in similar ways.
Tracealyzer is available for several common RTOS, including FreeRTOS, SafeRTOS, RTOS 32, Linux, VxWorks, Micrium µC/OS-III and ThreadX.
Here you can load the RTOS 1x1 White Paper with more Tips.


 damit Probleme schneller, vermeiden diese und optimieren die Performance Ihres Systems schnell und einfach.
