
Guest Blog (Wind River Blog Network)
By Dr. Johan Kraft, CEO & Founder of Percepio
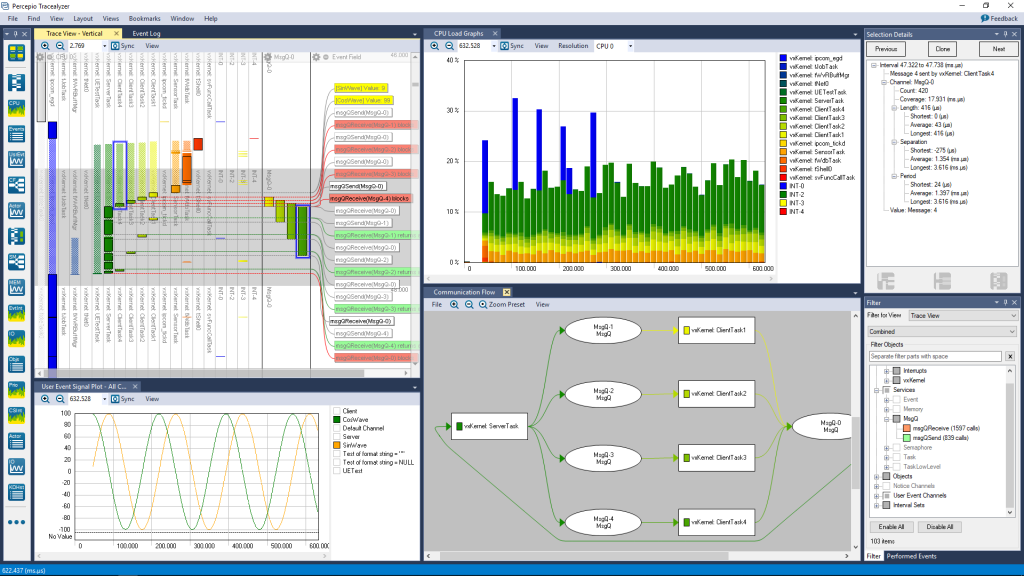
Tracealyzer is a trace visualization and analysis tool for embedded software developers. The recently released Tracealyzer version 4 for VxWorks gives the developer an unprecedented insight into the runtime behavior, leading to reduced troubleshooting time and improved software quality, performance and reliability.
Tracealyzer does not depend on special trace hardware which means that it can be used even outside the development lab, e.g. in field testing or as a flight recorder in deployed systems. The latter mode is particularly useful when developers are trying to capture a rare error that is hard to reproduce.
Tracealyzer does more than simply display the recorded data. It actually understands the meaning of VxWorks kernel events and leverages this to provide more advanced visualization of standard VxWorks traces. Apart from the innovative trace view, Tracealyzer also provides several other views like the Communication Flow, which is a dependency graph showing how tasks and other VxWorks objects are interacting in runtime. Another example is the Object Utilization view, showing the allocation of kernel objects over time (e.g. the size of message queues). All these views are interconnected in intuitive ways, just double-click on a data point to open a related view focused on the same data point, showing a different perspective and abstraction level. For instance, double-clicking on a “msgQReceive” event in the trace view opens the Object History view, showing all operations on that particular message queue. With multiple connected views at different abstraction levels, you can spot anomalies using the high-level overviews, like the CPU Load Graph and Statistics Report, and easily drill down to inspect the detailed events causing the anomaly.
The sophisticated visualization offered by Tracealyzer makes the trace data more accessible and usable, allowing developers to speed up debugging and verification.
Tracealyzer can be used side-by-side with traditional debugging tools such as those available in Wind River Workbench and complements a source-code debugger with several additional views on system level, ideal for understanding real-time issues and rare anomalies where a classic source-code debugger is not sufficient.
Continue Reading at the Wind River Blog Network website
 analysieren. Sie finden damit Probleme schneller, vermeiden Probleme und optimieren die Performance Ihres Systems schnell und einfach.