Percepio is the company behind the well-known Tracealyzer, a desktop application that enables embedded engineers to visually diagnose issues within their own software through traces. What is a trace? A trace is a low-level logging mechanism that can be used to interpret a system state during execution. Analyzing traces for microcontroller-based applications using FreeRTOS can save embedded engineers significant time and energy when troubleshooting unexpected behavior. Utilizing this tool with a FreeRTOS application requires a simple integration of the TraceRecorder library to capture traces. Traces can be recorded and saved with snapshots during program execution, or streamed in real-time.
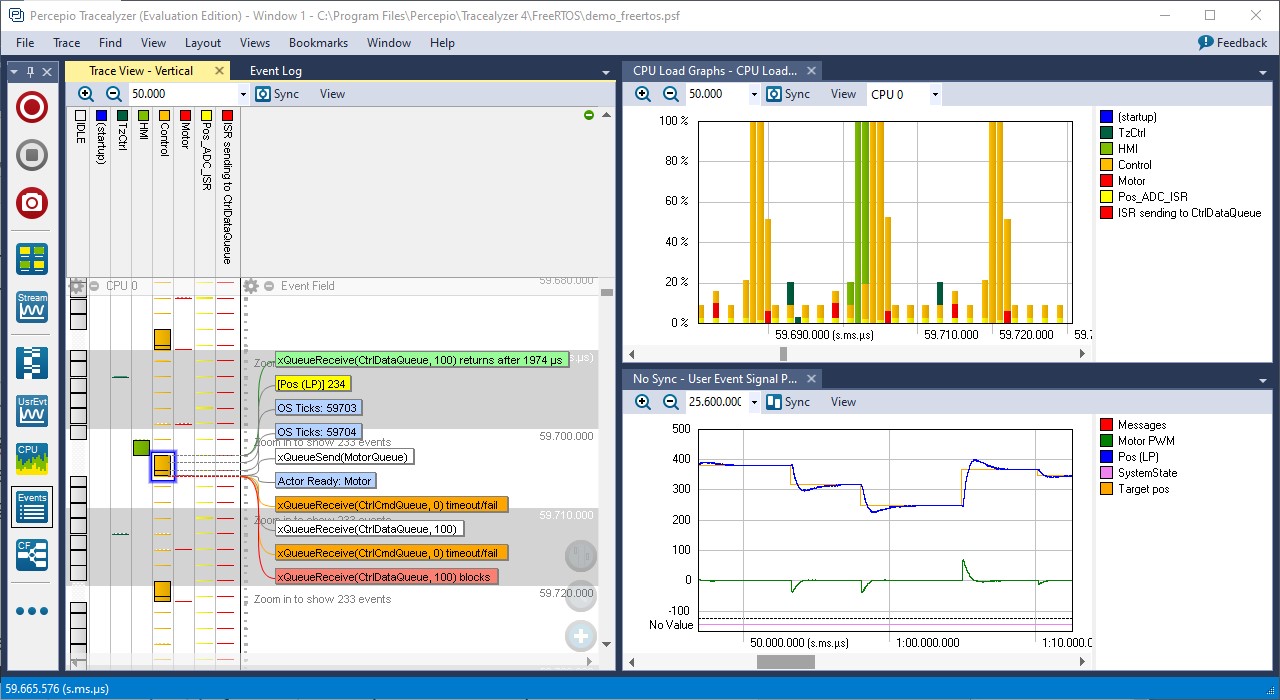
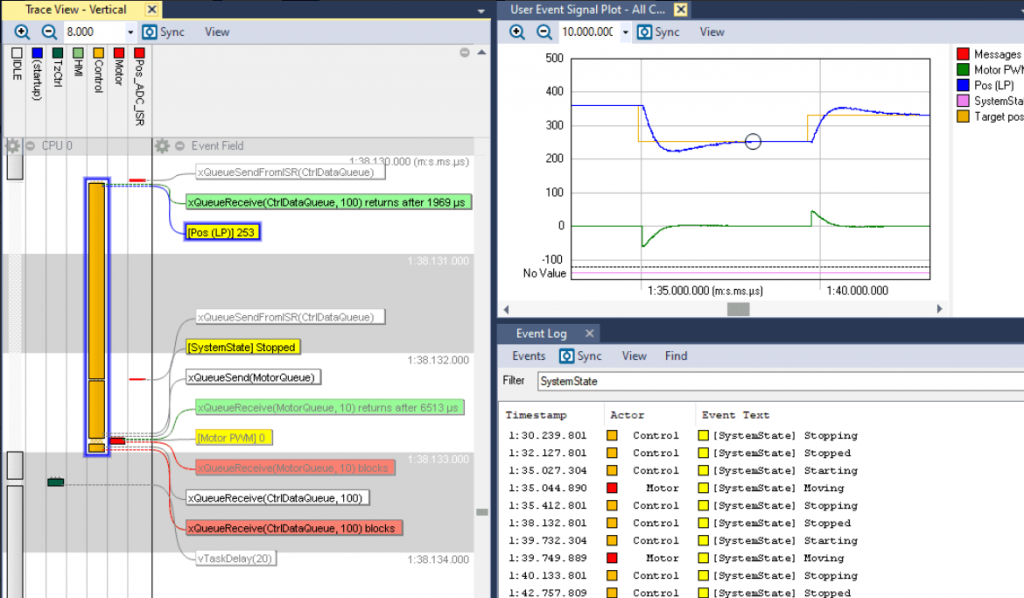
Once a trace is loaded, Tracealyzer can provide execution details with configurable views like the program timeline, event log, CPU load graphs, memory usage, task dependencies, and many other useful visualizations. These capabilities aid in what is referred to as observability. You can trace your tasks, as well as kernel API calls, at a deep level within your FreeRTOS application. Below is a snapshot of Tracealyzer running on a laptop with a sample FreeRTOS trace loaded. Notice the FreeRTOS API calls in the trace view panel, such as xQueueSend() and xQueueReceive(). Beyond just code debugging, you can also see the CPU load graphs correlated with the trace sequence.

continue reading at https://freertos.org


