The use of a Real-Time Operating System (RTOS) is increasingly common in embedded software designs. An RTOS makes it easy to divide your code into smaller blocks, tasks, which execute seemingly in parallel and independent of each other, as described in the first article in the RTOS 101 series.
Having fully independent tasks is rarely possible in practice. In many cases, tasks need to be activated on a particular event, e.g., from an interrupt service routine or from another task requesting a service. In such cases, tasks often need to receive related input, i.e., parameters. Moreover, tasks often need to share hardware resources such as communication interfaces which can only be used by one task at a time, i.e. mutual exclusion, a type of synchronization. Inexperienced developers may try to use global variables for such purposes, but implementing thread-safe communication is tricky and a home-cooked solution may fail if a task-switch strikes at a critical point. For instance, consider this situation:
1: while (COM1_busy); // if busy, wait until free
2: COM1_busy = 1;
3: SendBytes(COM1, data);
4: COM1_busy = 0;
The initial loop (line 1) may seem to give exclusive access to the COM1 interface (line 3), but if using an RTOS this is often not a safe solution. It probably works most times, perhaps often enough to pass all testing, but if an interrupt strikes after the initial loop on line 1 but before the assignment at line 2 and this results in a task-switch, a second task could get into the critical section before the first task is finished. Implementing a thread-safe critical section requires either disabling interrupts or using special instructions for atomic “test-and-set”. Considering this, it is typically easier (and safer!) to use the RTOS services intended for this purpose.
Most RTOS provides many types of mechanisms for safe communication and synchronization in between tasks and between interrupt routines and tasks. Common types are:
- Semaphore: a signal between tasks/interrupts that does not carry any additional data. The meaning of the signal is implied by the semaphore object, so you need one semaphore for each purpose. The most common type of semaphore is a binary semaphore, that triggers activation of a task. The typical design pattern is that a task contains a main loop with an RTOS call to “take” the semaphore. If the semaphore is not yet signaled, the RTOS blocks the task from executing further until some task or interrupt routine “gives” the semaphore, i.e., signals it.
- Mutex: a binary semaphore for mutual exclusion between tasks, to protect a critical section. Internally it works much the same way as a binary semaphore, but it is used in a different way. It is “taken” before the critical section and “given” right after, i.e., in the same task. A mutex typically stores the current “owner” task and may boost its scheduling priority to avoid a problem called “priority inversion”, discussed below.
- Counting Semaphore: a semaphore that contains a counter with an upper bound. This allows for keeping track of limited shared resources. Whenever a resource is to be allocated, an attempt to “take” the semaphore is made and the counter is incremented if below the specified upper bound, otherwise the attempted allocation blocks the task (possibly with a timeout) or fails directly, depending on the parameters to the RTOS semaphore service. When the resource is to be released, a “give” operation is made which decrements the counter.
- Queue: a FIFO buffer that allows for passing arbitrary messages to tasks. Typically, each queue has just one specific receiver task and one or several sender tasks. Queues are often used as input for server-style tasks that provide multiple services/commands. A common design pattern in that case is to have common data structure for such messages consisting of a command code and parameters, and use a switch statement in the receiver task to handle the different message codes. If using a union structure for the parameters, or even just a void pointer, the parameters can be defined separately for each command code.
Priority Inversion is what caused NASA problems on the Mars Pathfinder mission. This means that a higher priority task is accidentally delayed by a lower priority task, which normally is not possible in RTOSs using Fixed Priority Scheduling. This may however occur, e.g., if the high-priority task (“Task H”) needs to take a mutex that is currently held by a lower priority task (“Task L”). This blocks Task H until the mutex is available, and is often not a problem in itself since a mutex is typically only held for brief durations during a critical section.

However, as illustrated above, the blocking may become a lot longer if an unrelated medium-priority task (“Task M”) comes in and preempts Task L, thereby delaying the release of the mutex that Task H is waiting for. This phenomenon is called Priority Inversion. Most RTOS provide mutexes with “Priorty Inheritance” (or other similar protocols) which raises the scheduling priority the owner task if other higher priority tasks become blocked by the mutex, which avoids that medium-priority tasks interfere. Priority Inversion can also occur with queues and other similar primitives, as described in Customer Case: The mysterious watchdog reset.
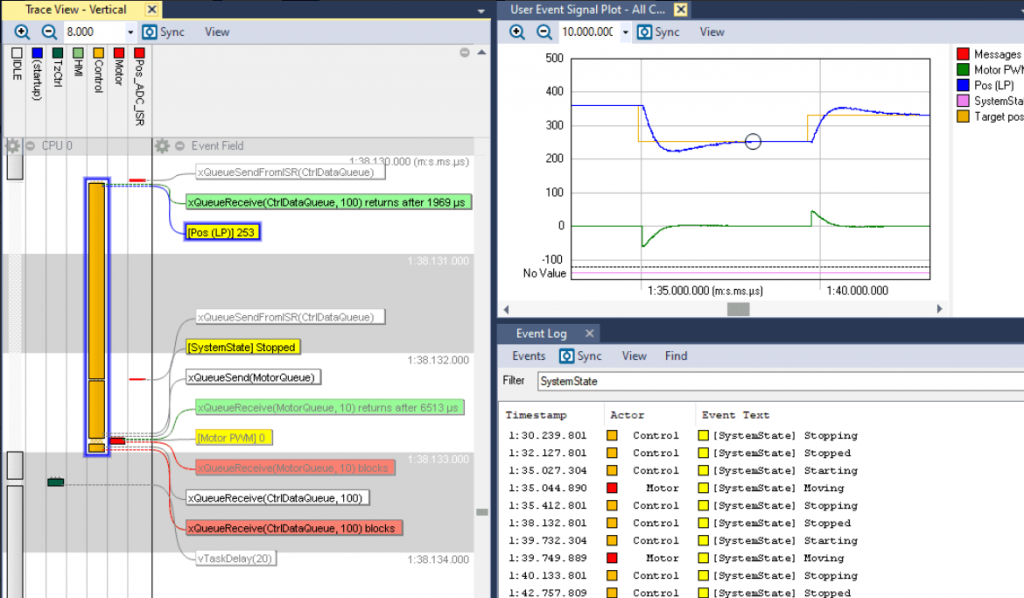
Percepio Tracealyzer allows you to see most RTOS calls made by the application, including operations on queues, semaphores and mutexes, in the vertical time-line of the main trace view, in parallel with the task scheduling, interrupts, and logged application events.
By clicking on any semaphore, queue or mutex event in the main trace view, you open up the Kernel Object History view for the selected object, as illustrated below, showing a separate timeline with all operations and states of this specific object. You can double-click in this view to find the corresponding event in the main trace view.
For queue objects, you also get a visual display of the number of messages in the buffer at any point, and you can even track messages from send to receive or vice versa. For mutex objects you see the name of the current owning task.
Tracealyzer also provides an overview of the interactions between tasks and interrupts via kernel objects such as queues, semaphores and mutexes. This gives a high-level illustration of the runtime architecture based on the trace, and you can even generate this for specified intervals in the trace. An example is shown below. Rectangles indicates tasks and interrupts, while ellipses indicate queues or semaphores. Mutexes are shown as hexagons. Since sometimes binary semaphores are used as mutexes, the classification of Mutexes are made based on their usage pattern, so semaphore objects may also be displayed with hexagons if they are used like a mutex, i.e., taken and given by the same task.
With Tracealyzer you get a superb solution for debugging, validation and performance analysis of RTOS-based embedded software. You get an exact picture of how the RTOS is executing your application, including the interactions between tasks via semaphores, mutexes and queues, as well as blocking and timeouts. This gives invaluable insight into the runtime world and facilitate development, validation and debugging of RTOS-based embedded software. Tracealyzer is also available for analysis of Linux systems.
Tracealyzer is available for several common RTOS, including FreeRTOS, SafeRTOS, Linux, VxWorks, Micrium µC/OS-III, and a version for ThreadX will be released during 2016. And we have several new and exciting analysis features in development that allows for even better performance analysis, so stay tuned!
 damit Probleme schneller, vermeiden diese und optimieren die Performance Ihres Systems schnell und einfach.